Data notes
What East Africa's agricultural data shows and how to read it: county prices, inputs, crop condition from satellites and rainfall, with every figure taken from the platform itself.
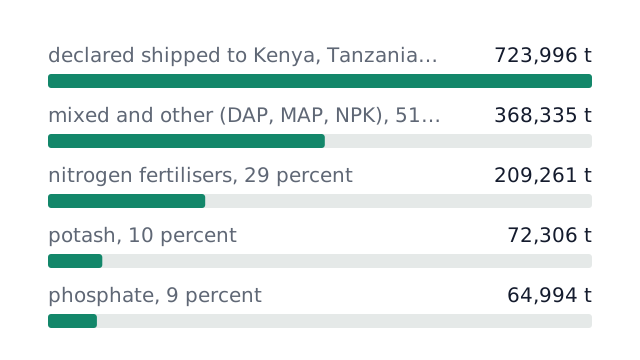
East Africa's fertilizer imports by type and price
Exporters declared 723,996 tonnes shipped to the four markets between August 2025 and July 2026. Half sits under the mixed heading that hides DAP and NPK, and Kenya plus Tanzania take 98 percent of it because the landlocked markets have no port.
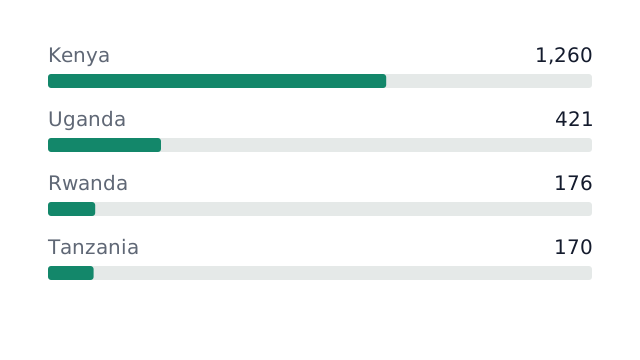
Agricultural news signals: how farm reporting becomes price and supply data
In the month to 11 October 2026 the dataset holds 2,027 signals rated medium or high trust, 1,260 of them Kenyan, with government programme the largest claim type. Each row keeps the verbatim quote and the link, so you can audit the label.
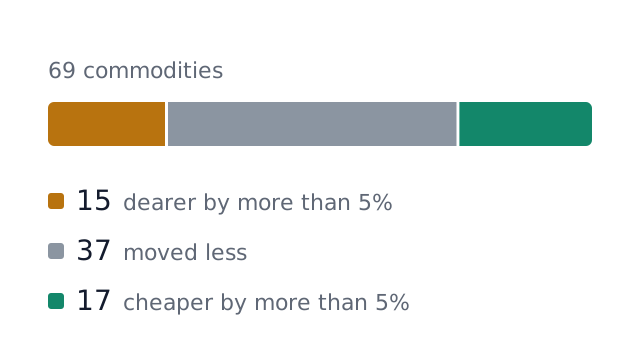
Commodity data from East Africa: market prices and auction results
Kenyan county rows cover about 195 commodities across 47 counties since May 2021, yet only 12 counties reported in the latest 30 days. A worked month-on-month comparison of 69 commodities shows how round-shilling pricing inflates the percentage moves.